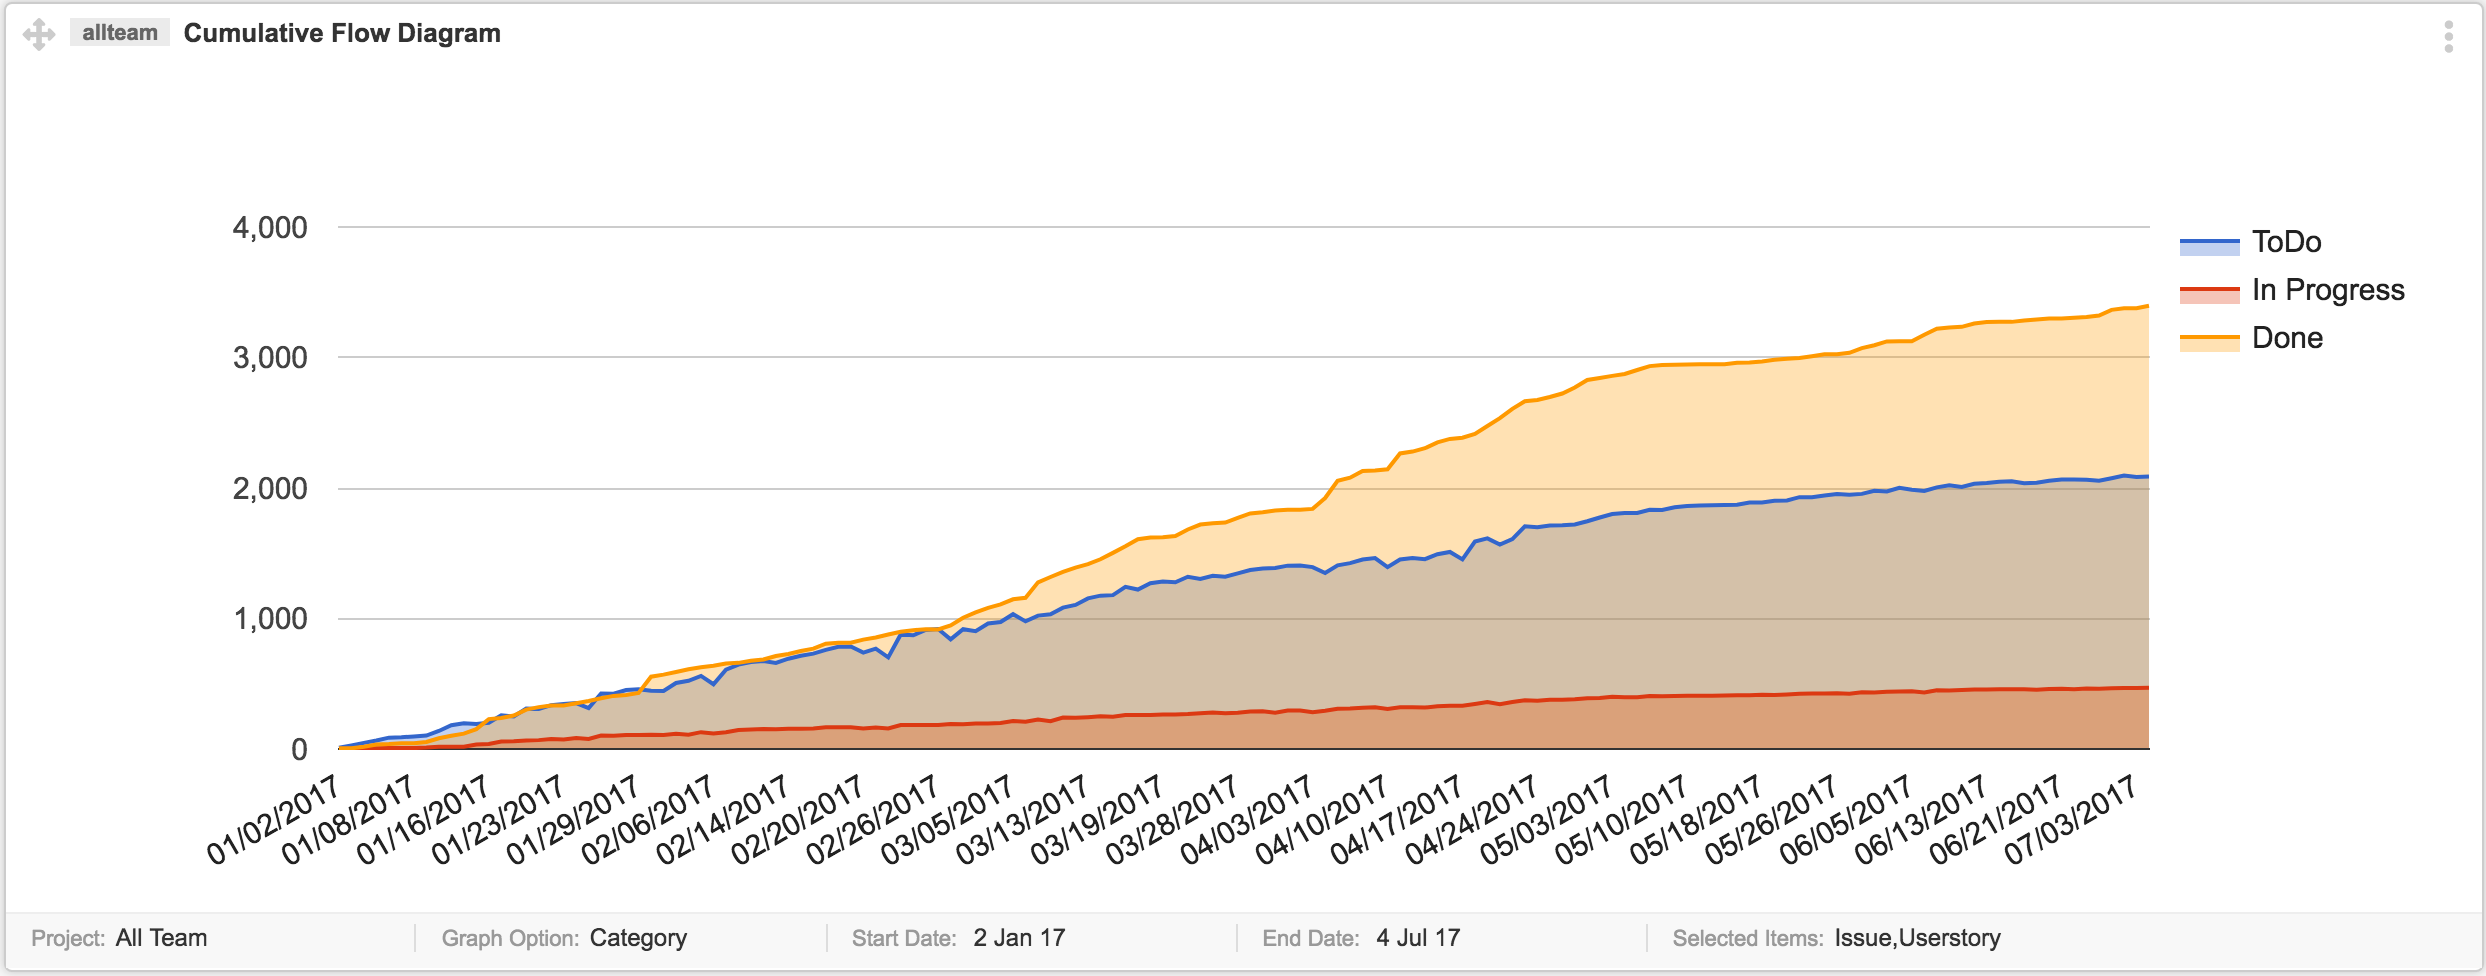
A Cumulative Flow Diagram is an area chart that shows the progress of a project work items for a particular period. This graph is a fundamental tool to visualize project progress and helps to spot potential problems. This diagram shows the count of Backlog items and pace of their progress for the selected past number of days. This is an advanced version of Burn-Up graph.

Use This Graph To:
Keep an eye on Progress: This chart gives you statistics of the amount of work in progress. It is counted by the number of unfinished items. You can see in a glance and conclude a hunch if the team will complete work on time, what is the speed of work, and if too much work in progress?
Estimate Item Completion: Use Lead Time to indicate the amount of time it takes to complete an item that is added to Backlog on a particular date. It can help in estimating the time required for Item to complete its lifecycle.
Identify Bottlenecks: A steep rise or drop in a graph indicates that there is a problem. Too much work in progress than Team usual velocity indicates a potential problem of leaving some stories undone at the end. A steep drop in Done may indicate a blocking reason that hinders team progress.
How to Interpret this graph
You can evaluate single project progress at a time using CFD. To determine project progress, use any of these 2 categories:
- CFD by category
- CFD by Status
CFD by Category
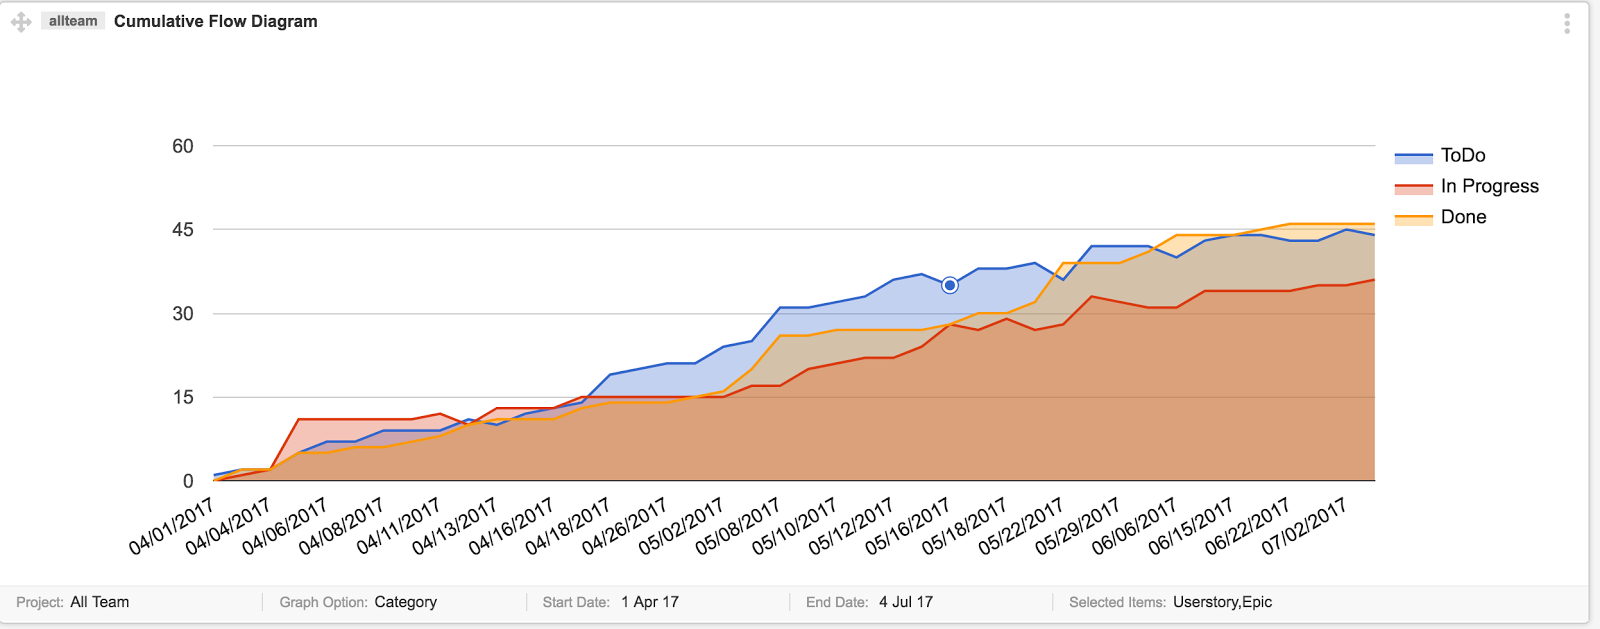
You can select multiple Item types at once. If you select User Story, it will count all Backlog User Stories falling under the set date criteria. Selecting Epic and User Stories at the same time will increase one count per Epic. Supported Item types are: Issue, Epic, User Story, and Task.

- Orange line indicates that how many items are Done
- Blue Line indicates that Project contents that are not started yet
- Red Line is an important factor to consider. You can see Team velocity by checking, how many items are In Progress as compared to newly added ones.
CFD by Status
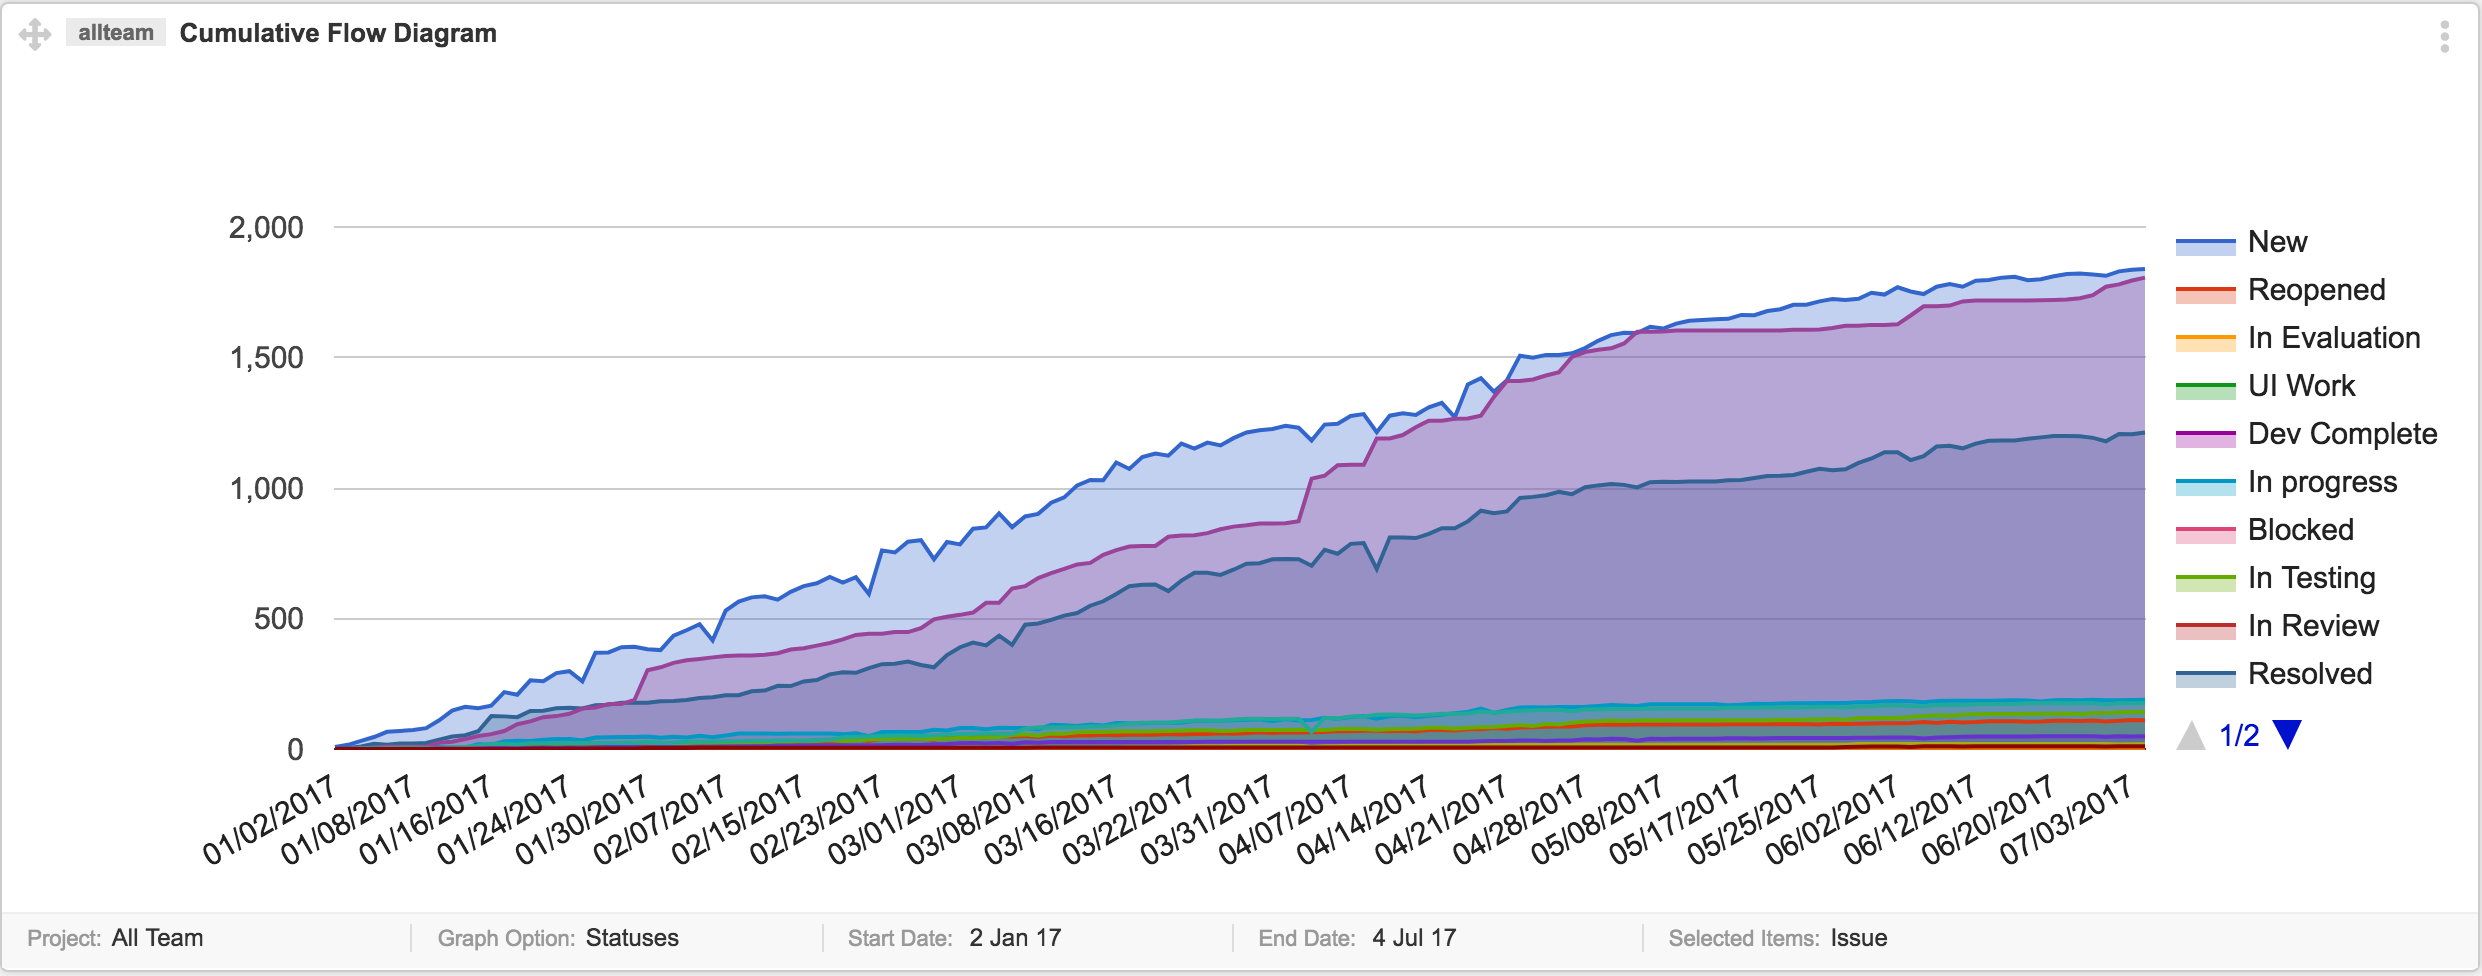
You can see project item progress by each defined status as well. Supported Item types are Issue, Epic, User Story, and Task. You can select only one Item type at once.

Each status is listed on the right side and clicks on it will highlight that line of the chart.
Important points
Start Data: CFD considers items which are created on the start date onwards. If an item was created a day before start date. No matter what its status is, it will not be considered in CFD.
End Date: it defines the duration for collecting statistics of Backlog items.
Relation of Status Set with CFD
Status Set has direct impact on the graph:
- When the selected project status set is switched to another scheme, then CFD will reset accordingly.
- When a particular project status is deleted, it will be reflected in CFD, and this count will be removed.
