This graph shows the pace of your team from finding an Issue till it is closed. This graph can help you in decision making by providing evidence of Issue life cycle span.
Some of the common examples of this report are:
- Number of new Issues reported each day
- Number of closed Issues each day
- Issues progress in a Sprint or Release
- New Issues vs Fixed issues in specified time period
- Total open issues per week/month
Issue trend varies with product maturity. At the start of new feature development, more issues are reported while you will notice the rise of resolved issues at the end of development cycle. You can see the Issue trend for any period of time in your project. The Issue count per each status progress is shown for each individual day.
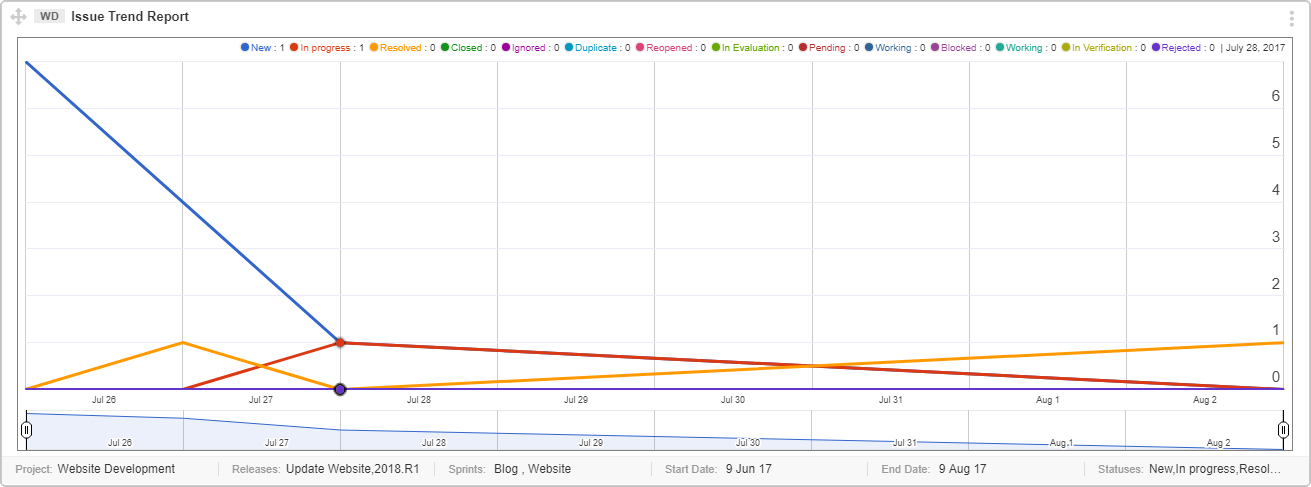
Interpret this graph
Issue trend is depicted as pivot graph showing different status with colored lines:
- The Y-axis of the graph shows you the number of Issues.
- The X-axis of the graph shows you the time elapsed.
- Each Issue is color coded by status and are shown at the top of the graph e.g. Issues that have been closed are shown in blue.
- You can shorten or expand the time frame for the graph by clicking and dragging the sliders at the bottom of the graph.
Prerequisite for Issue Graph
- Assign Issues to a Sprint or Release to get them fixed in targeted timeframe. It can be done in Sprint Planning or Release Planning meeting.
- Arrange an error triage meeting with stakeholders to make sure that right Issues are going to get fixed first and if severity is correct.
- Decide Your Query to create a useful Issue Trend Report, first define your needs. Graph fields help you create a more specific query. Selecting multiple criteria will be added as AND operator in the query.
Important Points
Please consider the points below while generating this graph.
- You can choose one or multiple statuses as per your requirement.
- You can select multiple Releases and Sprints to narrow down graph results.
- There are two types of reports available; Daily Report and Cumulative Report.
- Daily Report lets you choose desired Releases and Sprints for more accurate results.
- Cumulative Report shows the total amount of issues regardless of any sprint and release. Choosing this type of graph disables the option to choose desired Sprints and Releases.
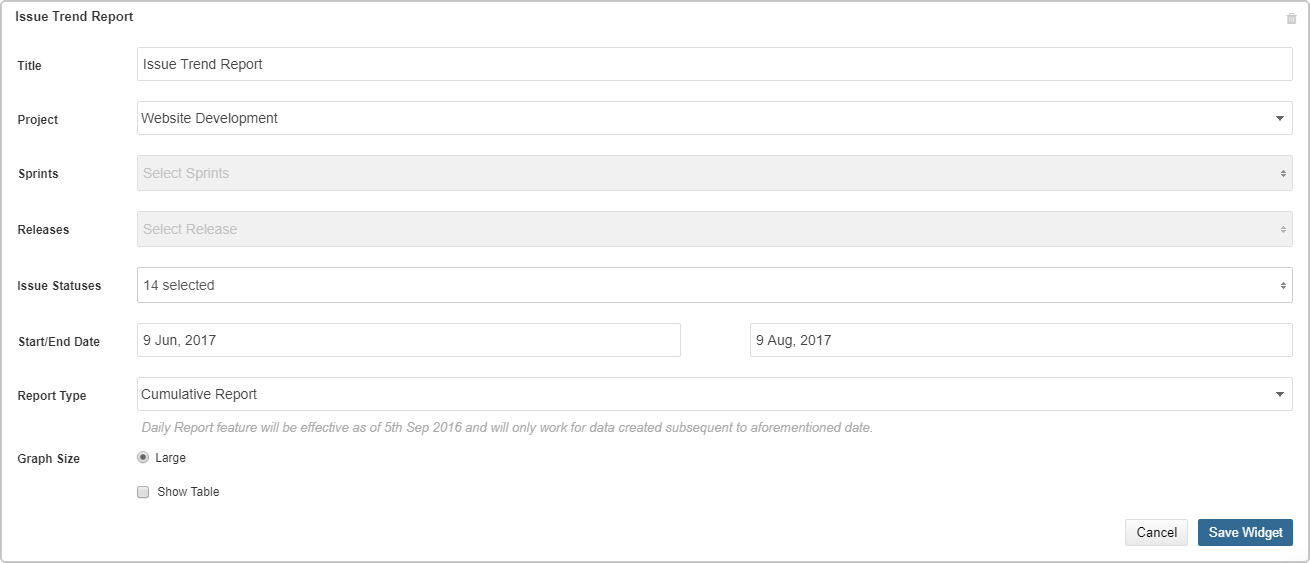
- Enabling the “Show Table” option will provide a stats table at the end of the graph.